CaseTalk’s Data Explorer offers powerful functionality that goes beyond traditional information modeling. While classical modeling focuses on conducting interviews with domain experts—capturing their knowledge and requirements in natural language—there are situations where access to live organizational data can significantly enhance the process. This is where the Data Explorer becomes invaluable.
By connecting directly to source systems, the Data Explorer allows modelers to browse actual datasets. This real-time access provides context that can sharpen interview questions, validate assumptions, and better illustrate how data is used and maintained within the organization.
Interactive Data Exploration
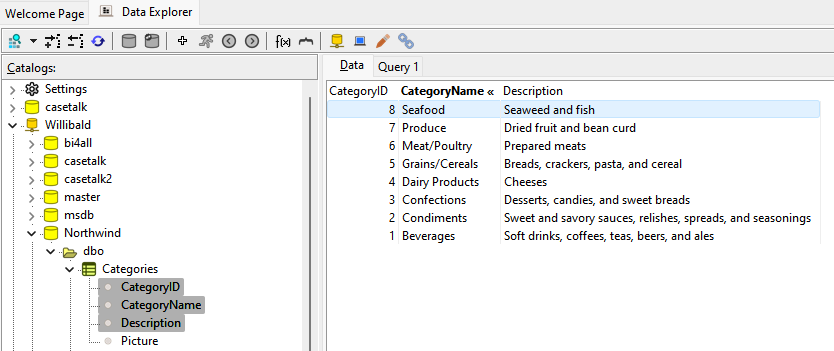
Once connected to a production system, users can interactively explore data tables. Multiple columns can be selected using Ctrl or Shift in combination with mouse clicks. After data is loaded, simply clicking on column headers enables instant sorting—making it easy to inspect patterns, inconsistencies, or trends in the dataset.
Discovering Unique Data Combinations
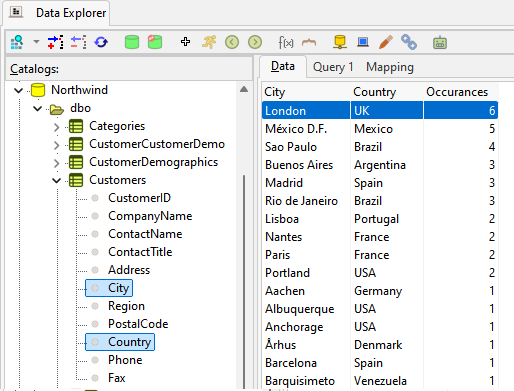
Identifying unique column combinations is essential when determining whether specific attributes can serve as keys or identifiers. The interface supports selecting multiple columns to test these combinations. A resulting "occurrence" column displays the count of duplicates, helping users recognize which combinations are unique and which are not.
For example, the image below shows six customers located in London, UK. This tells us that City and Country alone are insufficient to uniquely identify customers. However, this combination might still be useful when modeling Object Types to represent geographic structures in the conceptual model.
Aligning Source Data with the Conceptual Model
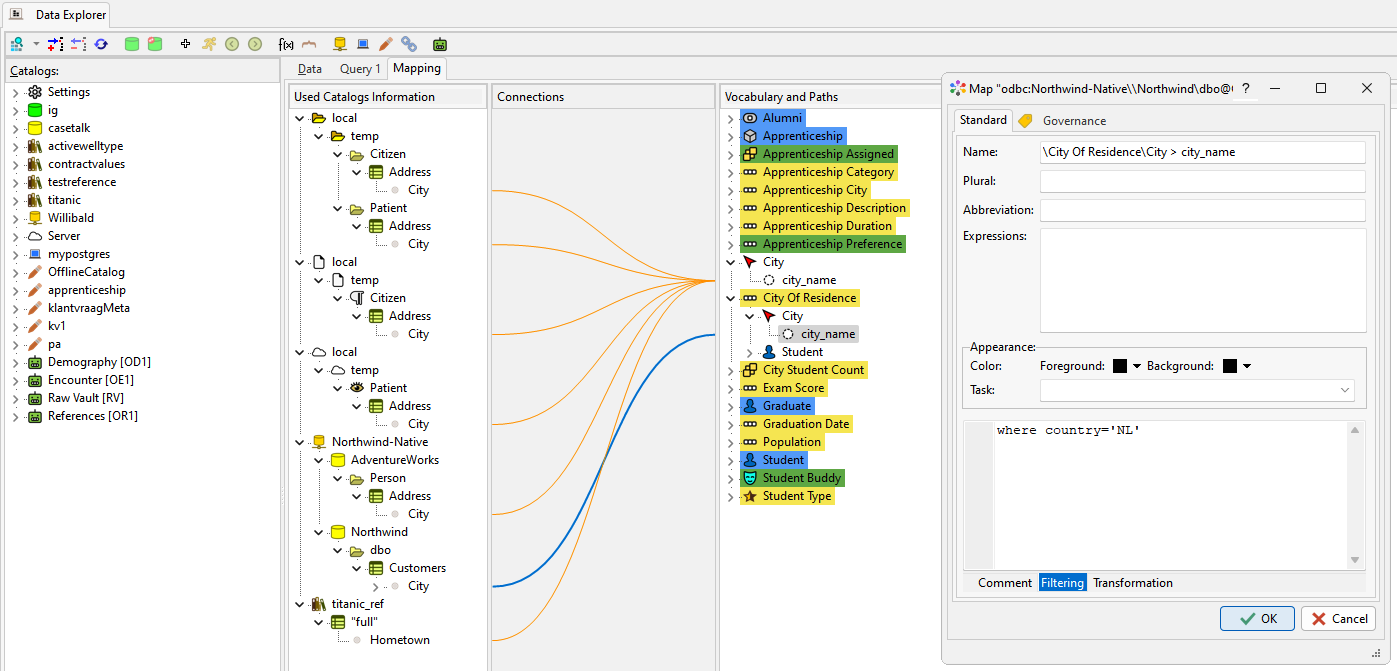
As the conceptual information model begins to take shape, aligning it with actual data sources becomes important for governance, traceability, and integration. The Data Explorer supports drag-and-drop mapping, allowing users to link source columns from available catalogs directly to model vocabulary paths.
These mappings are visually represented, showing how catalogs are connected to conceptual elements. Each connection can be annotated, color-coded, and configured with transformation or filtering rules—enabling automation and more transparent data lineage.
With these capabilities, CaseTalk’s Data Explorer bridges the gap between high-level modeling and hands-on data analysis. It empowers modelers to gain deeper insights, make more informed decisions, and ensure that technical implementations align closely with conceptual understanding.
For a recorded demo using the Data Explorer, visit this page.