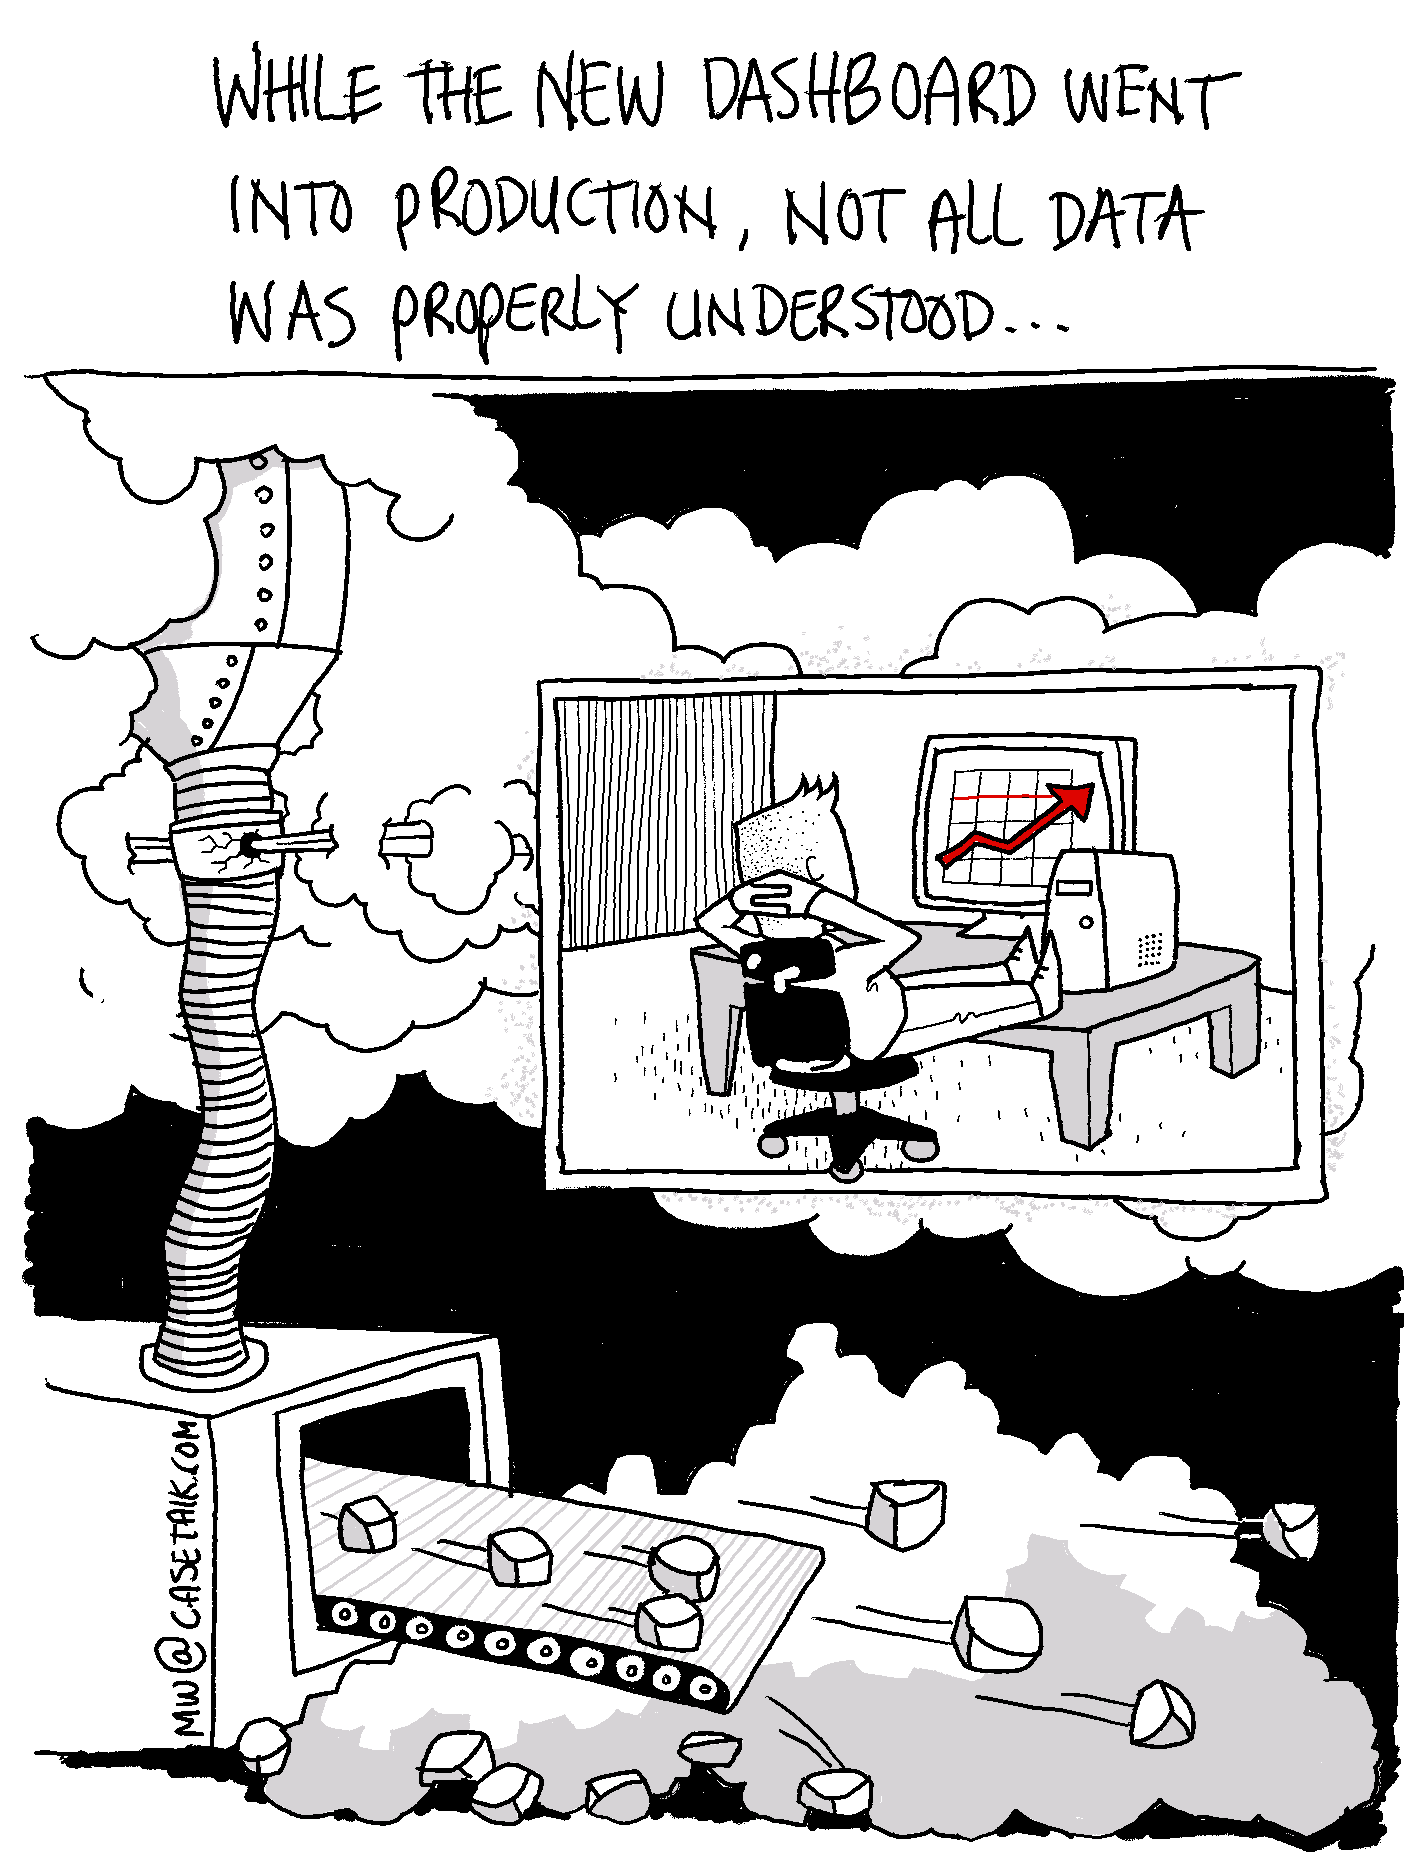
While another dashboard went into production, not all data was properly understood. It is an imaginative quote I heard in my mind while overhearing architects meet about the efforts they had to put in place when others developed yet another dashboard. The definitions and data were still not properly aligned, and business managers were given new dashboards on a whim. Would the dashboard really add to more valuable business management, or would it create another blindside to the entire staff for the real risks.
Having the dashboards to see measurements on how the organization is performing is a very natural thing. But if we do not measure how the dashboards themselves are set up, are we sure we are looking at the correct data, or just accidentally making things worse. Assuming the data presented is the real thing can be a dangerous thing, if it is not checked to be in line with the actual things happening in the organization.
To truly understand the 'data' we need to make sure everyone involved needs to agree on how they exchange it. An alignment and standardization process needs to be in place to guarantee things to be handled uniformly and unambiguous. This is where fact oriented information modeling comes in, a method to document how your business experts communicate about their data. An approach everyone understands correctly, and drives the IT products in a meaningful and efficient way, reducing risk and improving efficiency.
 This license allows reusers to copy and distribute the material in any medium or format in unadapted form only, for noncommercial purposes only, and only so long as attribution is given to the creator.
CC BY-NC-ND includes the following elements:
- BY – Credit must be given to the creator
- NC – Only noncommercial uses of the work are permitted
- ND – No derivatives or adaptations of the work are permitted